Quant (QNT) Market Analysis (18th July 2024)

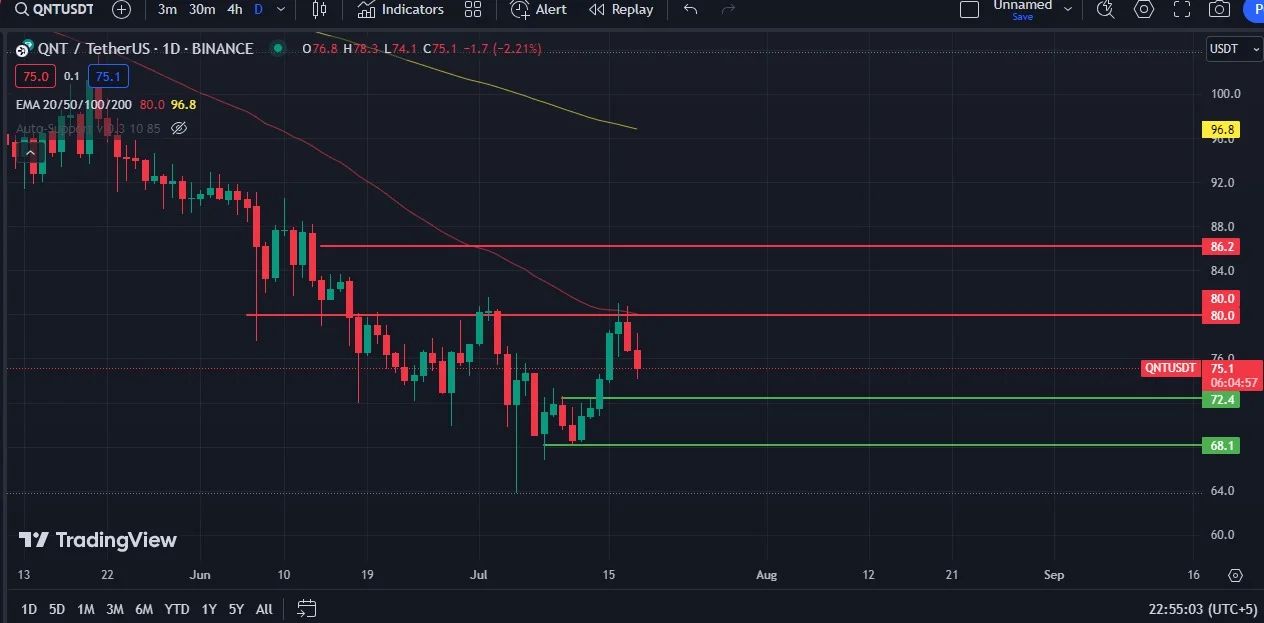
Quant (QNT) is currently trading at $75.1 USDT, facing a critical juncture as it navigates between key support and resistance levels on the daily chart. The cryptocurrency has been on a downward trajectory since mid-June, struggling to sustain any significant upward momentum. As we delve deeper into the technical aspects, we'll examine the crucial levels that traders should keep an eye on and the moving averages that are shaping QNT's market behavior.
Resistance and Support Levels
Resistance Levels:
- $80.0: This level has emerged as a formidable resistance point for QNT. The price has attempted to break above this threshold multiple times but has been met with strong selling pressure, indicating a significant psychological barrier. A successful break above this level could pave the way for a test of the next resistance at $86.2.
- $86.2: This level serves as another critical resistance. Should the price manage to break through the $80.0 resistance, $86.2 will be the next target for the bulls.
Support Levels:
- $72.4: The price has found support around this level in recent trading sessions. Holding above $72.4 could signal a period of consolidation, providing a foundation for potential upward movements.
- $68.1: If the price fails to hold above $72.4, the next significant support level is $68.1. This level could act as a strong support based on historical price action and may offer a crucial defense against further declines.

Moving Averages and Trend Analysis
The alignment of moving averages paints a clear picture of QNT's bearish trend. The 20-day EMA, 50-day EMA, and 100-day EMA are all trending downward, underscoring the prevailing bearish sentiment. The price is currently below the 20-day EMA, indicating short-term bearish momentum. Moreover, the 200-day EMA at $96.8 serves as a major resistance and a long-term trend indicator. The significant gap between the current price and the 200-day EMA highlights the extent of the bearish trend.
In summary, Quant (QNT) is navigating through a challenging phase with strong resistance at $80.0 and $86.2, and key support levels at $72.4 and $68.1. The bearish alignment of moving averages further supports the downward trend. Traders should closely monitor these levels and the price's interaction with the moving averages to gauge the potential direction of QNT. A break above $80.0 could signal a bullish reversal, while a fall below $72.4 may lead to further declines towards $68.1.


