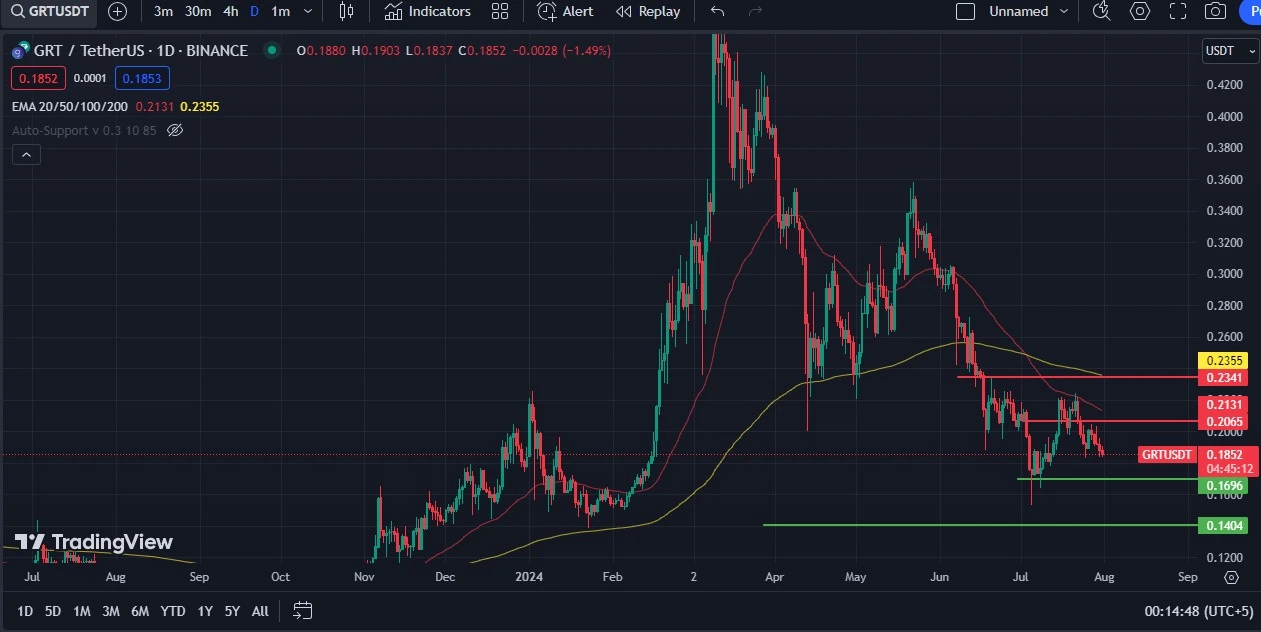
GRT/USDT Technical Analysis: Bearish Trend and Key Levels to Watch

Current Price and Trend Overview:
- Current Price: $0.1852
- Daily Low: $0.1837
- Daily High: $0.1903
- Price Movement: The price has decreased by 1.49% from the previous day.
Moving Averages:
- 20-day EMA: $0.2131
- 50-day EMA: $0.2341
- 100-day EMA: $0.2355
- 200-day EMA: $0.2355
The price is trading below all the key moving averages (20, 50, 100, and 200-day EMAs), indicating a strong bearish trend in the market. The 20-day EMA at $0.2131 is currently acting as the nearest resistance level.
Support and Resistance Levels:
- Immediate Resistance Levels:
- $0.2131 (20-day EMA)
- $0.2341 (50-day EMA)
- $0.2355 (100 and 200-day EMAs)
- Immediate Support Levels:
- $0.1696
- $0.1404
The nearest support level is at $0.1696, followed by a stronger support at $0.1404. These levels are critical as they provide a cushion against further downside movement.

Price Action and Pattern Analysis:
The price has been on a downward trajectory since reaching a peak in mid-April 2024. The recent price movement shows a consolidation phase between the support level of $0.1696 and the resistance at the 20-day EMA ($0.2131). This consolidation indicates a period of indecision in the market, where the price could potentially break out in either direction.
Indicators and Oscillators:
- Relative Strength Index (RSI): The RSI is likely in the lower range, indicating that the market is oversold. This could suggest a potential reversal or a period of consolidation before the next significant move.
- MACD (Moving Average Convergence Divergence): The MACD might be below the signal line, reinforcing the bearish sentiment. A crossover above the signal line would indicate a potential shift in momentum.
Conclusion and Strategy:
The GRT/USDT pair is currently in a bearish phase, trading below all major EMAs. The immediate resistance at the 20-day EMA ($0.2131) needs to be broken for a shift in momentum. Until then, the price is likely to remain under pressure with the possibility of testing the support levels at $0.1696 and $0.1404.
Trading Strategy:
- For Bulls: Wait for a confirmed breakout above the 20-day EMA ($0.2131) before entering long positions. A breakout above this level could target the 50-day EMA at $0.2341 and higher.
- For Bears: Look for opportunities to short on failed attempts to break the 20-day EMA, targeting the support levels at $0.1696 and $0.1404.
Risk Management:
- Set stop-loss orders just above the resistance levels to protect against unexpected breakouts.
- Ensure position sizing adheres to your risk management strategy to mitigate potential losses.
This analysis should help traders make informed decisions based on the current market conditions for GRT/USDT. Keep an eye on major economic news and market sentiment, as these can impact cryptocurrency prices significantly.


