Ethereum (ETH) Technical Analysis 1st August

Current Price Action
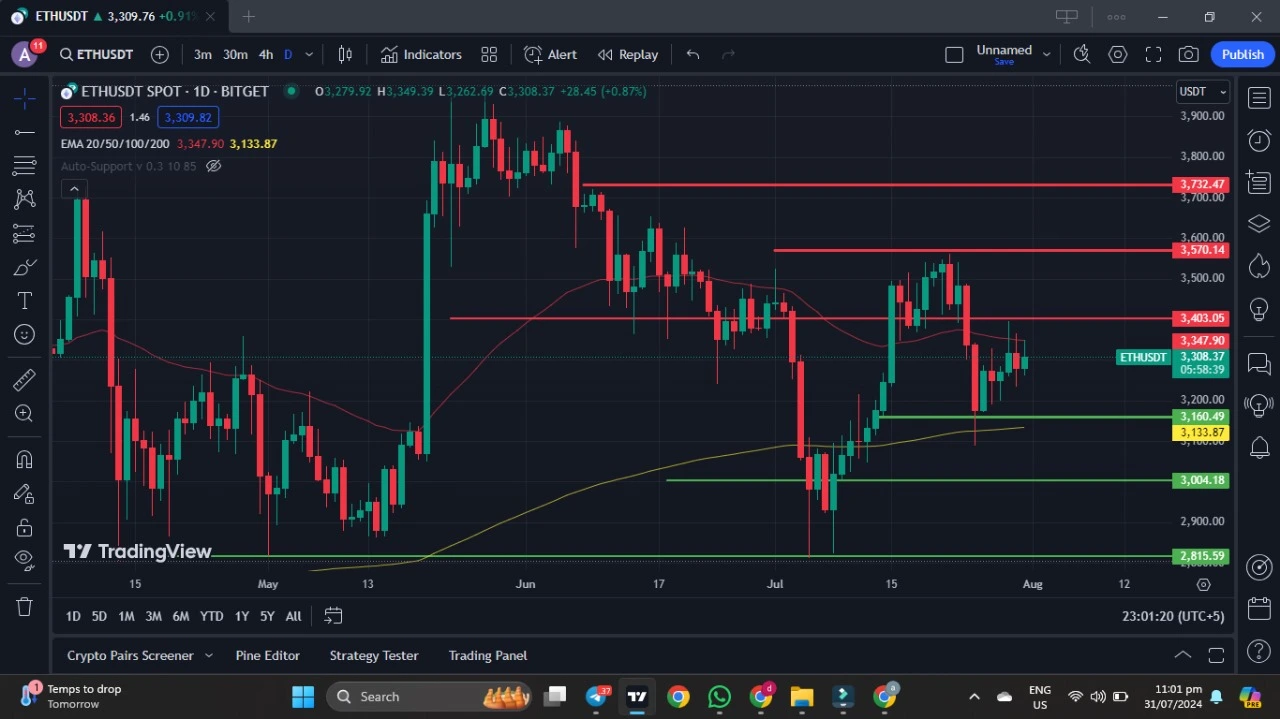
As of the latest data, Ethereum (ETH) is trading at $3,308.37, showing a positive movement of +0.87%. The chart shows a series of red and green candles indicating market volatility. There are significant support and resistance levels marked on the chart, providing insights into potential future price movements.
Key Support and Resistance Levels
- Resistance Levels:
- $3,403.05: This level has shown strong resistance, with the price failing to break above it multiple times.
- $3,570.14: Another resistance level where the price has struggled to maintain momentum.
- $3,732.47: The highest resistance level marked, indicating a major hurdle for the price to overcome.
- Support Levels:
- $3,160.49: The nearest support level, offering a potential bounce-back point if the price drops.
- $3,133.87: A significant support level, reinforced by the EMA 200.
- $3,004.18: A more robust support level, indicating a strong buying interest around this price.
- $2,815.59: The lowest support level, which could be tested in case of a major sell-off.
Moving Averages
- EMA 20/50/100/200:
- The Exponential Moving Averages (EMAs) for 20, 50, 100, and 200 days are crucial indicators of the trend.
- The current EMA levels indicate a mixed sentiment, with the EMA 20 being above the EMA 50 and EMA 100 but below the EMA 200.
- The EMA 200 at $3,133.87 acts as a strong support, suggesting that the long-term trend is still bullish despite short-term corrections.
Price Trend
- The price trend of ETH shows a significant upward movement from early May to mid-May, followed by a consolidation phase.
- A correction phase is observed from mid-June, with the price testing the lower support levels multiple times.
- Currently, the price is attempting to break above the immediate resistance at $3,347.90. A successful break and close above this level could pave the way for testing higher resistance levels.
Indicators and Patterns
- Volume: There is a noticeable increase in trading volume during price surges and drops, indicating strong market participation.
- Candlestick Patterns: The chart shows several doji and hammer patterns, indicating market indecision and potential reversal points.
- MACD and RSI: While these indicators are not visible in the provided chart, they would typically provide additional insights into momentum and overbought/oversold conditions.
Fundamental Analysis
- Network Upgrades: Ethereum's transition to Ethereum 2.0 and the implementation of the Proof of Stake (PoS) mechanism are significant developments that could positively impact the price.
- DeFi and NFT Growth: The growth of decentralized finance (DeFi) and non-fungible tokens (NFTs) on the Ethereum network continues to drive demand for ETH.
- Market Sentiment: Overall market sentiment, including regulatory news, institutional adoption, and macroeconomic factors, plays a crucial role in influencing ETH's price.
Conclusion
Ethereum's price action is currently at a critical juncture. The ability to break above the $3,347.90 resistance level and maintain momentum will be crucial for further bullish movement. On the downside, the support at $3,133.87 (EMA 200) and $3,004.18 provides a cushion against potential sell-offs. Investors should closely monitor these key levels and consider both technical indicators and fundamental developments when making trading decisions.


