DOT Coin Analysis Blog (18th July 2024)

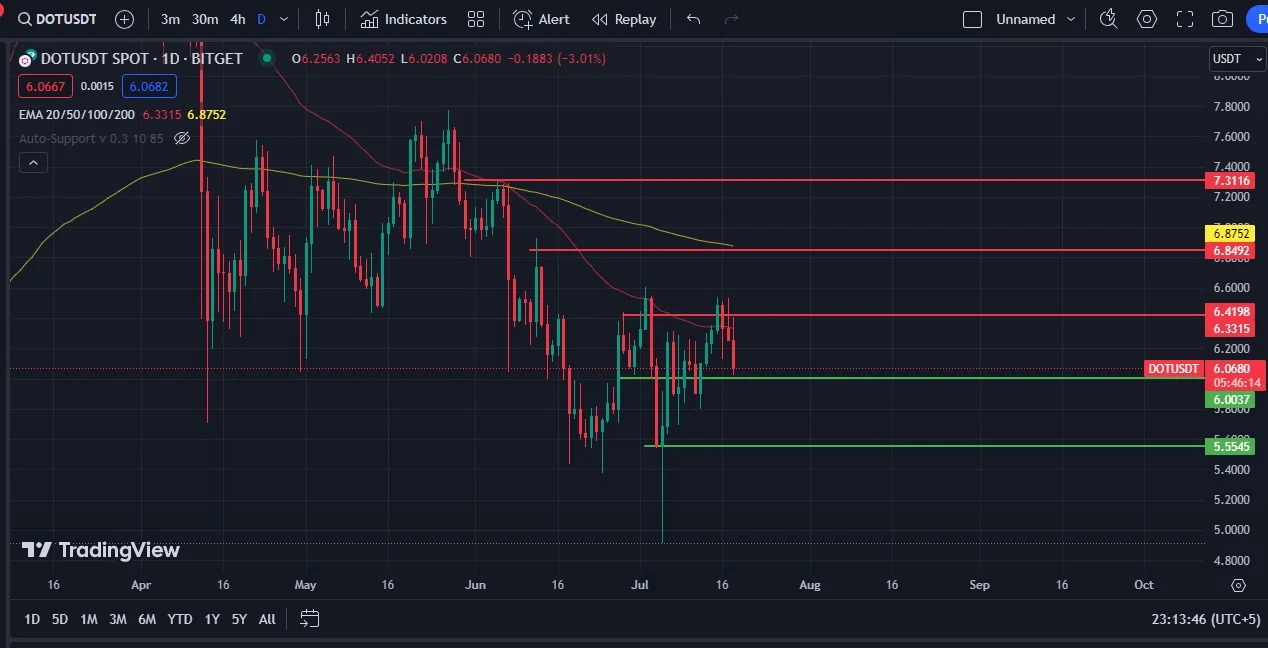
Polkadot (DOT) is currently trading at $6.0680 USDT, with the price action reflecting a period of consolidation and indecision. As DOT navigates through a range of key support and resistance levels, understanding these critical points can provide valuable insights into potential future movements.
Resistance and Support Levels
Resistance Levels:
- $6.3315 - $6.4198: This zone has emerged as a significant resistance for DOT. The price has repeatedly faced selling pressure around these levels, indicating a strong barrier for any upward movement. A breakout above this zone could signal a potential bullish trend.
- $6.8492 - $6.8752: This higher resistance zone includes the 100-day EMA, which is currently acting as a dynamic resistance. A break above this level could open the path towards the next major resistance at $7.3116.
- $7.3116: This level represents a major resistance and a critical target for bulls aiming to reverse the current bearish sentiment.
Support Levels:
- $6.0037: The immediate support level is just below the current price, offering a minor cushion against further declines. Holding above this level could indicate a consolidation phase.
- $5.5545: This key support level has acted as a strong defense in the past. A break below this level could lead to further bearish pressure and potential declines towards lower levels.

Moving Averages and Trend Analysis
The moving averages are providing a mixed picture:
- 20-day EMA: The price is hovering around the 20-day EMA, indicating indecision and potential for either side's dominance in the short term.
- 50-day EMA: The 50-day EMA is acting as a dynamic resistance around the $6.3315 - $6.4198 zone, reinforcing the importance of this resistance area.
- 100-day EMA: Located at $6.8752, the 100-day EMA is a significant resistance that needs to be breached for any substantial bullish reversal.
- 200-day EMA: The 200-day EMA at $7.3116 serves as a long-term trend indicator and a major resistance level.
Polkadot (DOT) is currently in a consolidation phase, with key resistance levels at $6.3315 - $6.4198 and $6.8492 - $6.8752, and major resistance at $7.3116. Support levels to watch are $6.0037 and $5.5545. The alignment of moving averages, particularly the 50-day and 100-day EMAs, indicates the need for a breakout above these dynamic resistances to signal a potential bullish reversal. Traders should monitor these critical levels and the price action around the moving averages for further clues on DOT's market direction.
Follow us on Telegram for the latest signals and updates: Join our Telegram


