Bitcoin Analysis Blog (18th July 2024)

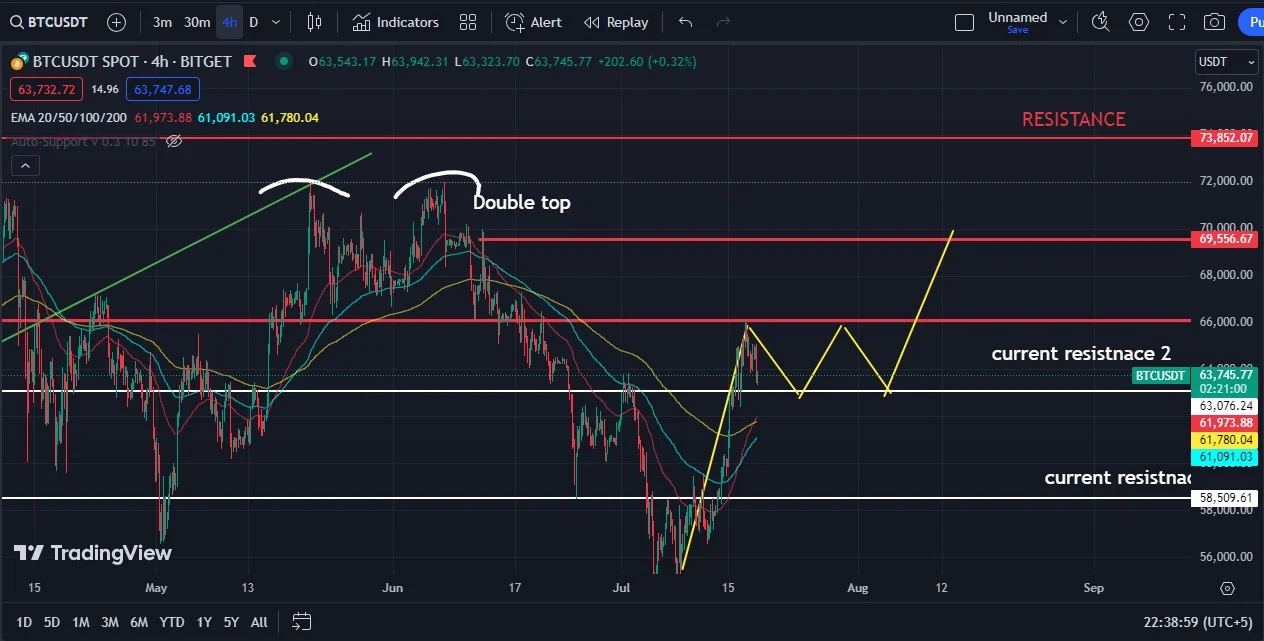
The Bitcoin (BTC) market is currently exhibiting bullish characteristics. As observed from the 4-hour BTC/USDT chart on Bitget, Bitcoin is in a consolidation phase, forming a bullish flag pattern. This pattern typically indicates a continuation signal in a prevailing bullish trend.
Technical Analysis
A double top formation was observed in early June, leading to a bearish trend characterized by two peaks at approximately the same price level followed by a decline, indicating a potential reversal. However, BTC has since found support and is now testing key resistance levels.
Key Resistance Levels
The key resistance levels to watch are $63,000 - $64,000, $66,000, $69,556, and $73,852. If BTC breaks the $66,000 resistance, it is likely to test the $69,556 level next. A successful breakout above $69,556 could push BTC towards the $73,852 resistance level.
Support Levels
On the support side, the $58,509 level has provided a strong base for BTC, preventing further declines. While BTC may continue to consolidate between the $63,000 - $66,000 range before making a decisive move, traders should watch for volume spikes and other indicators that may signal the next move. Although less likely given the current bullish momentum, a failure to break above $66,000 could lead to a retest of the $58,509 support level.

Fundamental Factors
Fundamental factors, such as recent political developments, may influence market sentiment. For example, the possibility of Trump becoming the next prime minister and his potential policies, such as cutting interest rates, could have a bullish impact on the market, further supporting BTC's upward movement.
Overall, the Bitcoin market is in a bullish consolidation phase with the potential for significant upward movement. The market outlook for BTC remains positive, with the bullish flag pattern indicating a continuation of the upward trend. Traders should stay vigilant for any breakouts from the current range and monitor fundamental developments that could impact market sentiment.


