Atom Analysis Blog (18th July 2024)

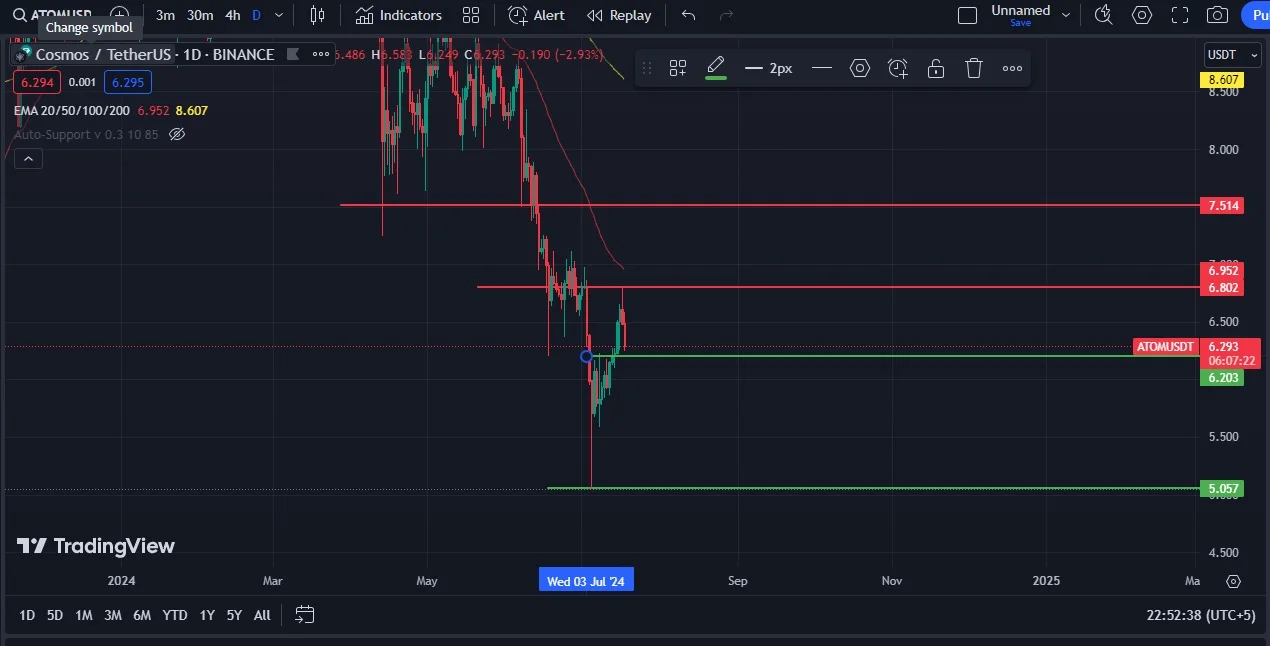
The daily chart analysis of ATOM/USDT on Binance shows that Cosmos is trading around $6.293, reflecting a slight decline of 2.93%. The chart presents a critical view of Cosmos's market behavior, highlighting key moving averages and significant price levels:
- EMA 20: $6.952
- EMA 50: $8.607
The EMAs indicate that Cosmos is currently trading below these key moving averages, suggesting bearish sentiment in the short term.
Resistance and Support Levels
The chart identifies several critical resistance and support zones:
Resistance Levels:
- $6.802: Immediate resistance level. A close above this level could indicate a shift in momentum.
- $6.952: EMA 20, a crucial level to watch for potential trend reversal.
- $7.514: A significant resistance level that, if breached, could confirm a bullish trend continuation.
Support Levels:
- $6.203: Immediate support level. Holding above this level is crucial for preventing further downside.
- $5.057: Major support level. A break below this could signal further bearish momentum.

Technical Indicators
Volume: Monitoring trading volume is essential to confirm any breakout or breakdown. An increase in volume on an upward move would support a bullish breakout, while a surge in volume on a downward move would confirm bearish momentum.
MACD: If the MACD line crosses above the signal line, it could indicate a potential bullish trend reversal. Conversely, if the MACD remains below the signal line, it suggests continued bearish sentiment.
Bearish Scenario: If Cosmos fails to hold above the immediate support at $6.203, it could decline further, testing the major support at $5.057. A break below this level would indicate strong bearish momentum and potential for further downside.
Cosmos's price action suggests a critical juncture, with key resistance and support levels providing a roadmap for potential trading strategies. Traders should keep an eye on technical indicators and volume to confirm the direction of the next significant move.
Trading Strategy:
- Long Position: Consider entering a long position if ATOM breaks and closes above $6.802, with a target of $6.952 (EMA 20). Place a stop loss below $6.203 to manage risk.
- Short Position: Consider entering a short position if ATOM breaks below $6.203, with a target of $5.057. Place a stop loss above $6.802 to manage risk.
Stay vigilant and monitor Cosmos’s price action closely. The upcoming sessions could present trading opportunities based on the confirmed direction of the market. Always stay updated with the latest technical indicators and market news to make informed trading decisions.
Follow us on Telegram for the latest signals and updates: Join our Telegram


