A Comprehensive Analysis of STORJ Coin

In the ever-evolving world of cryptocurrencies, STORJ has garnered significant attention due to its unique proposition in decentralized cloud storage. For traders and investors alike, understanding the technical aspects of STORJ is crucial for making informed decisions. In this analysis, we'll delve into the recent price movements, technical indicators, and potential future scenarios for STORJ/USDT.
Understanding the Current Landscape
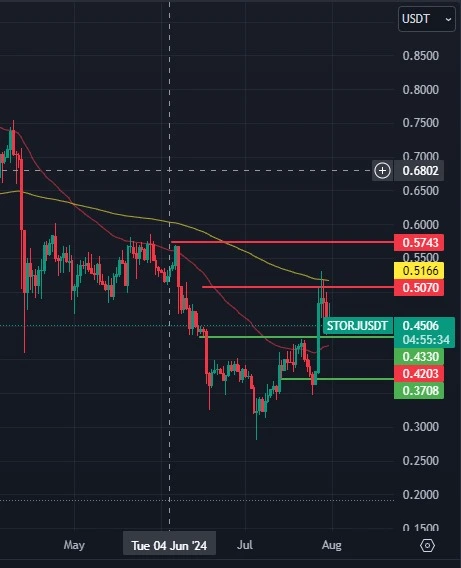
As of the latest data, STORJ is trading at approximately $0.4506. To get a clearer picture, let’s break down the key elements visible on the provided chart.
Key Support and Resistance Levels
- Immediate Resistance: $0.5070
- Next Resistance: $0.5166 (50-day moving average)
- Major Resistance: $0.5743
- Immediate Support: $0.4330
- Next Support: $0.4203
- Major Support: $0.3708
The price has recently rebounded from a low of $0.3708 and is now attempting to breach the immediate resistance at $0.5070. This level is crucial as it has been tested multiple times, making it a significant barrier for further upward movement.
Moving Averages: Gauging the Trend
Moving averages are essential tools for identifying the direction of the trend. In this analysis, we observe the following:
- 50-day Moving Average: Positioned at $0.5166, this level acts as a short to medium-term resistance.
- 200-day Moving Average: Positioned at $0.5500, this level serves as a long-term resistance.
Currently, STORJ is trading below both the 50-day and 200-day moving averages, suggesting a bearish trend in the medium to long term. For a bullish reversal, the price needs to break above these moving averages and sustain those levels.

Price Patterns and Market Sentiment
The price action of STORJ reveals some interesting patterns:
- After hitting a low of $0.3708, the price surged to $0.5743 before facing strong resistance and correcting to the current level of $0.4506.
- The rejection at $0.5743 indicates substantial selling pressure, which traders need to be cautious of.
- The current consolidation phase between the support and resistance levels could lead to a breakout in either direction.
Potential Scenarios and Trading Strategies
Bullish Scenario
In a bullish scenario, STORJ would need to break and hold above the immediate resistance at $0.5070. This move would likely attract more buyers, pushing the price towards the 50-day moving average at $0.5166. A sustained move above this level could target the 200-day moving average at $0.5500. Breaking this major resistance could open the doors to retesting the recent high of $0.5743 and potentially higher levels.
Key Levels to Watch in a Bullish Scenario:
- Break and hold above $0.5070
- Target $0.5166 (50-day moving average)
- Next target $0.5500 (200-day moving average)
- Major target $0.5743 and beyond
Bearish Scenario
Conversely, if STORJ fails to break the immediate resistance, it might retest the support levels. A drop below the immediate support at $0.4330 could lead to further declines towards $0.4203 and the major support at $0.3708. Continuous trading below the moving averages reinforces the bearish outlook.
Key Levels to Watch in a Bearish Scenario:
- Failure to break above $0.5070
- Retest $0.4330 support
- Next target $0.4203
- Major target $0.3708
Conclusion: Stay Informed and Prepared
The STORJ coin presents an intriguing opportunity for traders, with significant levels to watch on both the upside and downside. As always, staying informed and employing risk management strategies are essential for navigating the volatile crypto markets. Whether you're bullish or bearish on STORJ, understanding these key technical levels will help you make more informed trading decisions.
For the latest updates and more in-depth analyses, stay tuned to our blog. Happy trading!


